You can test staking plans to see how they work over a series of bets.

On the left side you can see staking plan’s parameters. This part depends on a staking plan that you choose.
On the right side there are settings used for the test. There are two ways to generate bets – Random bets and System bets.
(A) Random bets – creates a series of bets using random odds.
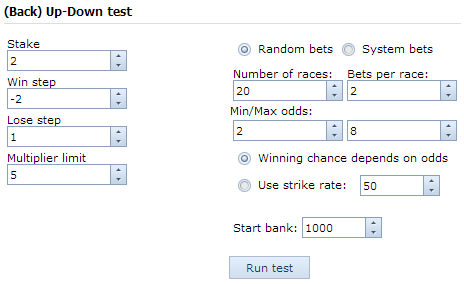
Settings for this option can be seen on the above image.
1. Number of races – number of races where bets will be randomly generated. The maximum number is 100.
2. Bets per race – how many bets should be per race. The overall number of bets will be equal to [Number of races] x [Bets per race]. Using more than one bet per race is good for dutch staking plans, because their nature expects more than one bet. Other staking plans can be tested fine with 1 bet per race. Maximum number of bets per race is 3.
3. Min/Max odds – all bets will be generated within the min/max odds range.
4. Winning chance depends on odds – if selected, the bot will calculate chances of a runner to win as 1/odds. For example, if odds is 2.50 then chance to win is 1 / 2.5 = 0.4 or 40%.
5. Use strike rate – if selected, the strike rate will be used to calculate chances to win for all bets regardless of odds. The same winning chance will be used to generate bet’s outcome for odds of 1.5 and 10.0.
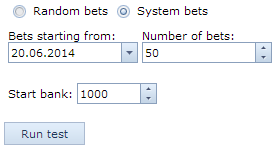
(B) System bets – the bot will take real bets from the system and recalculate stakes using chosen staking plan.
Only fired and settled bets are used, but not ‘cancelled’. This allows to back test staking plans using real bets placed in the past. This option has its own parameters:
1. Bets starting from – a date used to take first bet from the system. If there are no bets placed on this day, the bot will look for bets made on the following day and so on. If there are not enough bets on this day, bets from the following days will be taken.
2. Number of bets – how many bets to take for the test. The maximum number if 300.
Start bank – a bank used to run the test.
Run test button – runs the test and displays results.
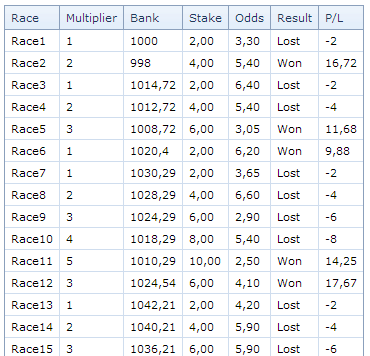
The following image is showing test bets for (Back) Up-Down staking plan using ‘Random bets’, Number of races = 100, Bets per race = 1, Min odds = 2, Max odds = 8, Winning chance depends on odds, Start bank = 1000:
1. Race – race number or race name (if ‘System bets’ option is used).
2. Multiplier – this is a changing parameter from (Back) Up-Down staking plan. There can be other different columns with parameters depending on staking plan.
3. Bank – shows running bank before the bet.
4. Stake, Odds, Result – the bet and its result (Won or Lost).
5. P/L – profit or loss of the bet. If there is only one bet per race P/L is displayed with Betfair commission (5%) deducted. If there are more than one bet per race P/L does not deduct Betfair commission. It is because Betfair commission must be deducted from cumulative profit for all bets placed in the race and deducting it from each bet individually would not be correct. Anyway the bank is updated using race P/L with Betfair commission taken into account.
Bets Statistics
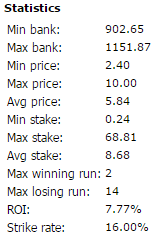
The test function displays statistics for bets and stakes that were produced. It shows min, max and average figures on the whole range of produced bets.
Max winning run – max number of won bets in the row.
Max losing run – max number of lost bets in the row.
ROI (return on investment) – net profit divided by sum of all stakes.
Strike rate – % of bets that won.


